70-degree days (12 monthly maps)

Van Living Forum

Help Support Van Living Forum:

This site may earn a commission from merchant affiliate links, including eBay, Amazon, and others.

Richard

Well-known member
Joined
May 3, 2016
Messages
274
Reaction score
2
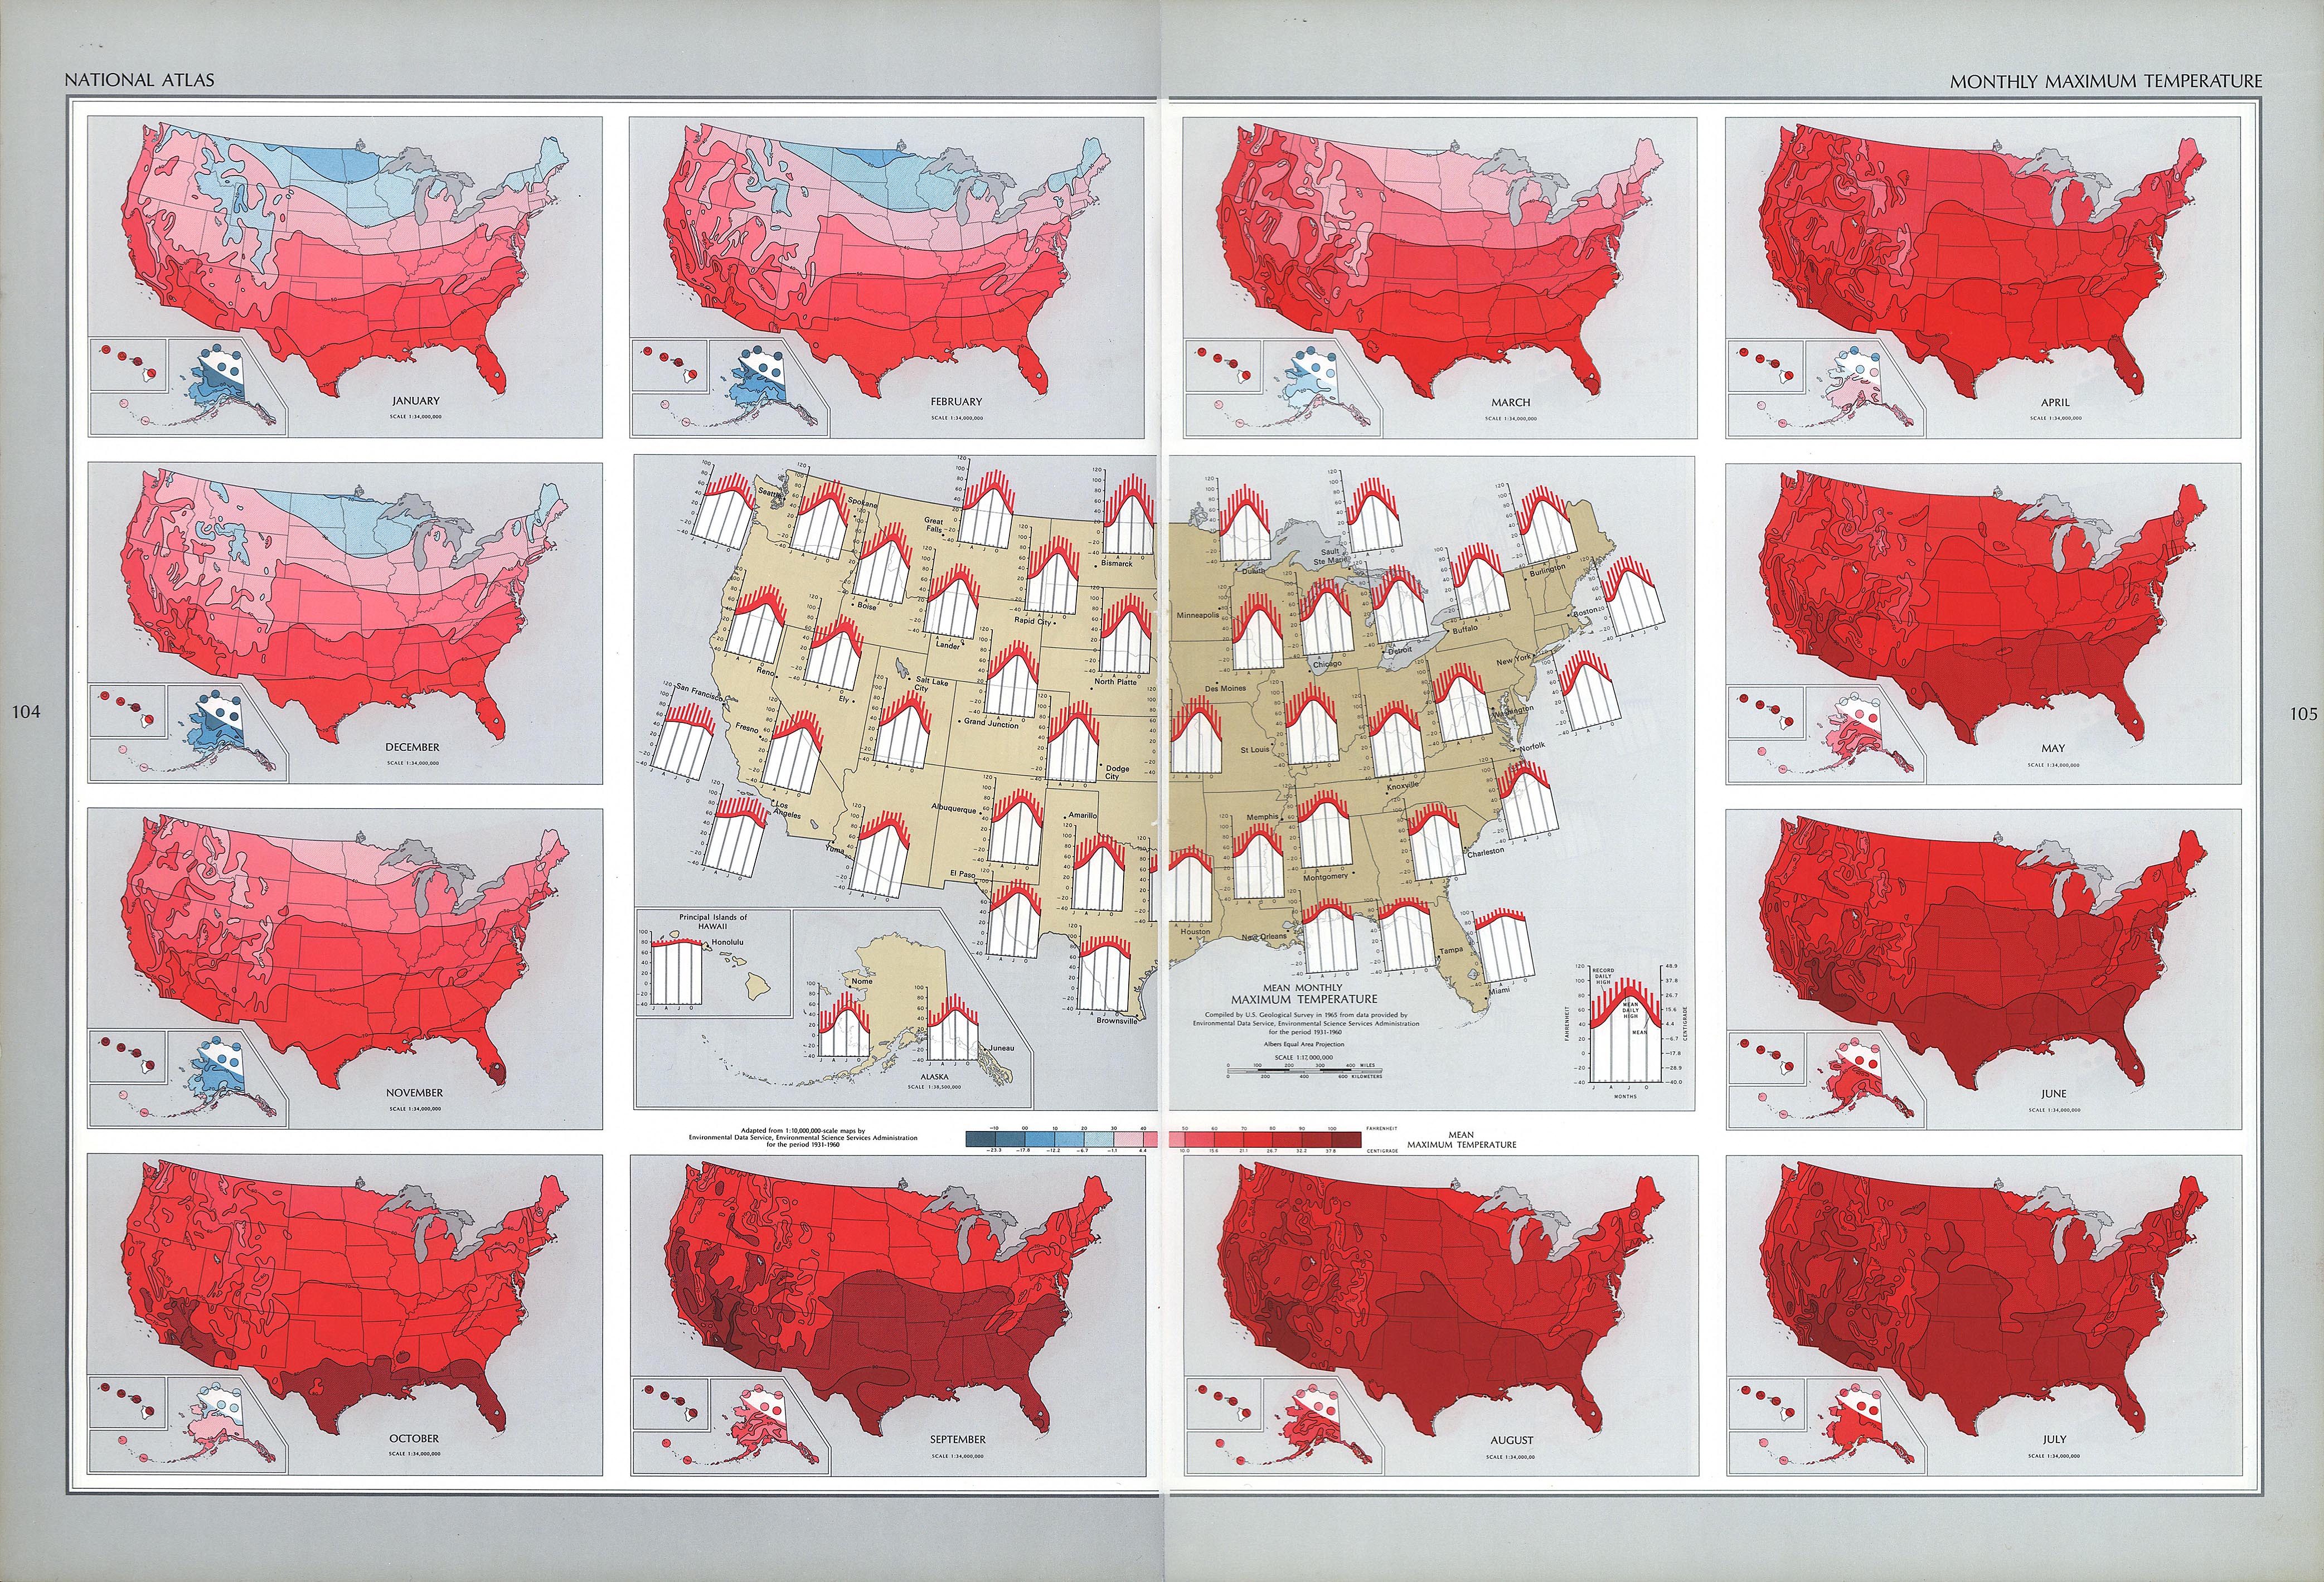
After reading the thread Optimal driving route for 70 degree high every day yearI got curious whether it was possible to find 70-degree days year-round. To answer this question, I used data from nearly 7,200 weather stations run by the national weather service to create a Google Map for each month of the year.

The maps show monthly averages of daily high temperatures for each weather station, averaged over 30-years time (to smooth out any extremes due to unusual circumstances).

With the '70-degree days' goal in mind, I keyed these maps to show the following:

  • Hearts in a green circle are the 'sweet spot': 68-72 degrees.
For a bit of context, I also color-coded a 5-degree range above and below that sweet spot:

  • Tiny blue dots are daily high temperatures between 63 and 67 degrees.
  • Tiny orange dots are daily high temperatures betweem 73 and 77 degrees.
The remaining tiny gray dots are temperatures that fall outside this overall 15-degree range of temperatures (so, either below 63 or above 77).

Anyone who's seriously interested in mapping out where to be for year-round 70-degree days will find these maps invaluable. July and August are the months with the fewest locations in that sweet-spot temperature range (68-72) so I suggest first picking places from those months and then planning the rest of your travels around those relatively limited options.

Each map will take a few moments to load because of the number of weather stations it includes. Once loaded, make sure the check box next to each of the 4 layers is checked. This will make visible the locations. All 4 layers ought to be checked (I had to use 4 layers because Google Maps limit each map layer to a maximum of 2,000 data points. Given nearly 7,200 weather stations, that's 4 layers).

These are standard Google Maps which I've shared to anyone who has the link. No sign-in is required, but they are read-only. For anyone who may wish to use this data in their own Google Maps, I've exported the data for each month's map into .kmz files. If anyone would like to import this data into their own Google Maps, let me know and I'll upload those files someplace where you can download them.

Happy journeys!


JANUARY (click here for map)
  • 71 weather stations showing 73-77 (Five degrees ABOVE sweet spot). 
  • 128 weather stations showing 68-72 (Seventy degrees, plus/minus 2).
  • 257 weather stations showing 63-67 (Five degrees BELOW sweet spot).
FEBRUARY (click here for map)
  • 133 weather stations showing 73-77 (Five degrees ABOVE sweet spot). 
  • 189 weather stations showing 68-72 (Seventy degrees, plus/minus 2).
  • 504 weather stations showing 63-67 (Five degrees BELOW sweet spot).
MARCH (click here for map)
  • 232 weather stations showing 73-77 (Five degrees ABOVE sweet spot). 
  • 733 weather stations showing 68-72 (Seventy degrees, plus/minus 2).
  • 827 weather stations showing 63-67 (Five degrees BELOW sweet spot).
APRIL (click here for map)
  • 911 weather stations showing 73-77 (Five degrees ABOVE sweet spot). 
  • 996 weather stations showing 68-72 (Seventy degrees, plus/minus 2).
  • 1,191 weather stations showing 63-67 (Five degrees BELOW sweet spot).
MAY (click here for map)
  • 1,370 weather stations showing 73-77 (Five degrees ABOVE sweet spot). 
  • 1,930 weather stations showing 68-72 (Seventy degrees, plus/minus 2).
  • 1,348 weather stations showing 63-67 (Five degrees BELOW sweet spot).
JUNE (click here for map)
  • 1,504 weather stations showing 73-77 (Five degrees ABOVE sweet spot). 
  • 521 weather stations showing 68-72 (Seventy degrees, plus/minus 2).
  • 130 weather stations showing 63-67 (Five degrees BELOW sweet spot).
JULY (click here for map)
  • 406 weather stations showing 73-77 (Five degrees ABOVE sweet spot). 
  • 82 weather stations showing 68-72 (Seventy degrees, plus/minus 2).
  • 42 weather stations showing 63-67 (Five degrees BELOW sweet spot).
AUGUST (click here for map)
  • 637 weather stations showing 73-77 (Five degrees ABOVE sweet spot). 
  • 107 weather stations showing 68-72 (Seventy degrees, plus/minus 2).
  • 34 weather stations showing 63-67 (Five degrees BELOW sweet spot).
SEPTEMBER (click here for map)
  • 1,816 weather stations showing 73-77 (Five degrees ABOVE sweet spot). 
  • 1,390 weather stations showing 68-72 (Seventy degrees, plus/minus 2).
  • 348 weather stations showing 63-67 (Five degrees BELOW sweet spot).
OCTOBER (click here for map)
  • 920 weather stations showing 73-77 (Five degrees ABOVE sweet spot). 
  • 1,169 weather stations showing 68-72 (Seventy degrees, plus/minus 2).
  • 1,325 weather stations showing 63-67 (Five degrees BELOW sweet spot).
NOVEMBER (click here for map)
  • 247 weather stations showing 73-77 (Five degrees ABOVE sweet spot). 
  • 579 weather stations showing 68-72 (Seventy degrees, plus/minus 2).
  • 810 weather stations showing 63-67 (Five degrees BELOW sweet spot).
DECEMBER (click here for map)
  • 86 weather stations showing 73-77 (Five degrees ABOVE sweet spot). 
  • 115 weather stations showing 68-72 (Seventy degrees, plus/minus 2).
  • 352 weather stations showing 63-67 (Five degrees BELOW sweet spot).

If you have any questions about, or problems with, the maps, let me know and I'll do my best to answer/fix things. Enjoy!
 
That is some valuable information and I'm sure it will make life more comfortable for a lot of folks. Thanks for sharing!
 
You've made a very common mistake of thinking average daily highs means the temperatures will be that all the time. It does not. In my experience, (which is a whole bunch of days in all those places trying to stay cool) it means about half the time it will hotter (easily 10 degrees), and half the time it will be cooler.

Average temperatures are pretty worthless, especially when you consider 2016 was the hottest year ever recorded, 2015 was the second hottest year ever recorded, and 2014 was the third hottest year ever recorded.

It still comes down to this, nearly all of them are over 10,000 feet, or on the coast.
 
akrvbob said:
You've made a very common mistake of thinking average daily highs means the temperatures will be that all the time. It does not.

I'm not sure why you think I've made a mistake in thinking that average temperatures means all-the-time temperatures. I don't think that at all.


akrvbob said:
In my experience, (which is a whole bunch of days in all those places trying to stay cool) it means about half the time it will hotter (easily 10 degrees), and half the time it will be cooler.  

Yes, there will be variations. Many of the weather stations I looked at include standard deviations for their recorded temperatures. I've only looked at a small sample of stations but the ones I checked tended to show standard deviations in the neighborhood of 3 to 5-degrees. No doubt some stations vary more, other stations vary less. Experience certainly can fill in the gaps but the data is a good starting place for those of us still accumulating experience.


akrvbob said:
Average temperatures are pretty worthless, especially when you consider 2016 was the hottest year ever recorded, 2015 was the second hottest year ever recorded, and 2014 was the third hottest year ever recorded.

Even with the recent increases in seasonal/yearly temperatures, the averages are still useful even if only in a relative sense. For example, my decision to sandwich 70 in the middle of a 5-degree range of temperatures means that two locations marked with green hearts may be 68 and 72 degrees respectively. If the 68 location happens to be 5-degrees cooler on a certain day, and the 72 location happens to be 5-degrees warmer, they'll actually be 63 and 77 degrees respectively. The data are a guide, not a guarantee. They're useful in a relative sense... in a trending sense... but of course we understand that 'past performance is no guarantee of future results'. That said, the map is a tool that's likely to be useful despite it not being a guarantee. As such, I hardly think that qualifies as 'pretty worthless' unless one assumes that the data is some kind of guarantee. I don't assume that at all.

Obviously my post would be TL;DR for many people if I attempted to turn it into a statistical and meteorological 'lesson' so my working assumption is that most people who have an avid interest in temperature as a means to comfort are also somewhat familiar with related variables like dew point, humidity, elevation, wind speed, and the idea of micro-climates. Unfortunately, none of those values were easily correlated, programmatically, with the monthly averages. I may invest more time refining my program to make stronger links but in the interest of getting something useful and not too complicated out quickly, I have assumed a bit of familiarity on the part of interested readers.

All that said, the maps I created are just tools meant to assist in the decision-making process. If a person is familiar with what I've mentioned in reply to you so far, they may already realize a couple points of interest:

1. Any location embedded within several other nearby locations of the same temperature range is more likely to be close to the recorded temperatures than a single location standing in isolation, and
2. Any location with plenty of nearby 'buffer' locations on both the high and the low side is likely to offer the most convenient opportunity to adjust to real-time variation from the averages.

As I wrote in my original post, if anyone has any questions about the maps, I'm happy to do my best to answer if I can.


akrvbob said:
It still comes down to this, nearly all of them are over 10,000 feet, or on the coast.

In July and August, most of them are West Coast, particularly the Pacific Northwest area. Some in Colorado at elevation, yes. That only accounts for 2 months out of 12, though. In December, January, and February, most of the locations are Southern California, Texas Gulf coast, and most of Florida. For the remaining 7 months of the year, 70-degrees can be found all over the place below 10k feet elevation and not on the coasts. Given the earlier thread's emphasis on driving to find such weather, the number of locations where such temperatures are likely to be found offers enormous variety in the routes one may plan and be reasonably close to the desired 70-degree mark.

While far from perfect, and despite not offering any guarantees, I think the maps are useful tools in their own right when used thoughtfully.
 
Very thorough and comprehensive job assimilating that data. Thank you for taking the time to do it.
 
You are totally right, those maps are very good work and very helpful. Thank you for doing it! I apologize that I've over-reacted to this whole idea.

The problem is it isn't a realistic goal to travel through the summer and keep the temperatures below 70. It simply can't be done and I hate that the idea is given credence. If you spent the summer in one place, you might could keep it below 80, but I doubt it. I spent a summer in Leadville, Co at 10,400 feet and I promise it frequently got well above 70 and broke into the low 80s, and you can't do much better than 10,400 feet in the forest. On my days off I went to Vail, CO to the nearest Walmart and it was only 8500 feet and was always well into the mid to upper 80s on a clear summer day. My dog went with me and I had to be very careful to find shade for him or he would be at risk. I spent August 2015 in Steamboat Springs, CO at 9800 feet and again, it was hot and hit 80 regularly.

On paper and in theory it may be possible, the reality is that it is not.
 
I am currently at 9500' in SW Colorado. June is the hottest month and we had a few days when it broke 80. The monsoons have started and the afternoon relief is great. Sunset rainbows are a bonus. If I was at a lower elevation I would want to be near water.
 
Richard, thank you. 

I appreciate your efforts!  You did an amazing job, and I'm sure it took some time to do.  I hope these maps stay available online for a long time, because some of us are not yet on the road and it might take us a while to get out there.

As for accuracy, I think most people are intelligent enough to know that weather is changeable, that factors such as humidity and wind play a huge role in comfort levels, and no prediction is guaranteed.

For me, personally, I am glad you also have points marking places where the temperature range tends to be a bit cooler than the oft-preferred "sweet spot" -- because I prefer cooler weather.  Also, it's great that your map covers the entire US, because not every nomad out there wants to spend most of their time in the West or in compete wilderness.
 
Thanks for all the information. It should be a valuable tool for many of us.
BTW, why do we think the low 80's as being hot? During July, August, and September, if I can find a place in the low 80's for a high, I'm in heaven.
 
I am fine even in the 90's just as long as it cools down at night. I don't work out in the sun during the hot part of the day. in the high desert you get huge temp swings from day to night sometimes as much as 50-60 degrees. highdesertranger
 
Links aren't working, but are your maps different than the below, from the National Atlas?

akrvbob said:
In my experience, (which is a whole bunch of days in all those places trying to stay cool) it means about half the time it will hotter (easily 10 degrees), and half the time it will be cooler.  

I agree.  Average max isn't that helpful.  There's also the fact that many places peak at a high temp for only an hour only to drop for the majority of the daylight hours.  E.g., looking for warm places, I'd rather have a humid/party cloudy January day on the coast of southern California mostly in the low 60's than a cold sunny day in Yuma that peaks to 73 at 2pm then drops to dry and cold the rest of the day.

ca000079.jpg
 
Svenn said:
Links aren't working

Hm... I just clicked a few and it seems to work for me. I also asked a friend to click them and they work for my friend, too. If it seems like it's taking a long time to load, that's because there are 7,200 data points on the map. It takes 5-6 seconds for the map to appear after I click a link. Is it possible you thought the delay meant it wasn't working?

In any case, if it's really not working for you, I'd like to figure out what's wrong and try to fix it. When you click on one, what do you see in your web browser? It's a standard Google map so I imagine it would work in all of them but just to get more information, what web browser are you using?

Let me know and we'll try to get this working for you.


Svenn said:
, but are your maps different than the below, from the National Atlas?

Yes. Given the many individual data points, my map will reveal individual weather station values, including being able to identify micro-climates (something the National Weather Maps don't show).

Meanwhile, here are screenshots of 4 the maps I linked-to: January, April, July, October.

Chasing 70 ~ January SS.jpg
Chasing 70 ~ April SS.jpg
Chasing 70 ~ July SS.jpg
Chasing 70 ~ October SS.jpg
 

Attachments

  • Chasing 70 ~ January SS.jpg
    Chasing 70 ~ January SS.jpg
    1,018.6 KB · Views: 11
  • Chasing 70 ~ April SS.jpg
    Chasing 70 ~ April SS.jpg
    1.1 MB · Views: 6
  • Chasing 70 ~ July SS.jpg
    Chasing 70 ~ July SS.jpg
    1 MB · Views: 7
  • Chasing 70 ~ October SS.jpg
    Chasing 70 ~ October SS.jpg
    1.1 MB · Views: 7
This is fascinating, and maybe something some already knew, but I was clueless. It's one of those things that my dad, who knew everything-really he did- would have known! Thanks for sharing.
 
Great post and appreciate the time and effort you put into it. Spending the summer on the Kenai Peninsula in Alaska. Mostly 60's during the day 40s/50s at night. Thanks again.
 
Great job. I'd love to be able to dl them.

Have you thought about making an app to where we can plug in the type of weather we are looking for preferably with our chosen date range (current or future)? I am asking, since I love the more humid, sunny beach days w a very light breeze but also love to play in the snow on occasion. Plus, My Pomeranian [emoji190] (@PompomMitzy on Facebook) likes it a bit cooler than I do.

Sent from my SM-N910V using Tapatalk
 
mspriusV said:
Great job. I'd love to be able to dl them.  

Have you thought about making an app to where we can plug in the type of weather we are looking for preferably with our chosen date range (current or future)? I am asking, since I love the more humid, sunny beach days w a very light breeze but also love to play in the snow on occasion. Plus, My Pomeranian [emoji190] (@PompomMitzy on Facebook) likes it a bit cooler than I do.

Sent from my SM-N910V using Tapatalk

Thanks, and yes, I'm toying with the idea of an app. The data source is text files. For searching from an app, I imagine it would have to be imported into databases and hosted elsewhere. I'm not sure (yet) that I want to take on hosting data but I am considering it.
 
The issue I see is that you did not go far enough and overlay with a free campsite map. j/k

Thanks.
 
Top